Two more studies analyzing interactions with voice search and virtual assistants were released this week: one from Stone Temple Consulting and the other from digital agency ROAST. The latter focuses on Google and explores voice search for 22 verticals. Stone Temple’s report compares virtual assistants to one another in terms of accuracy and answer volume.
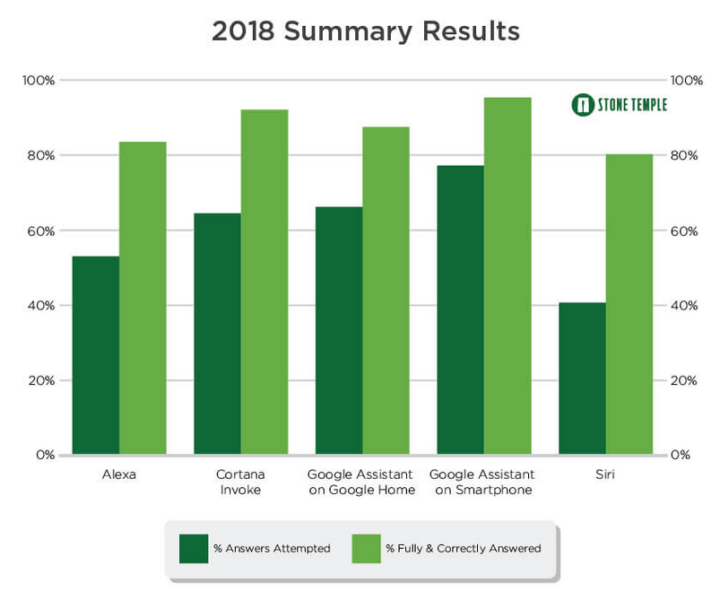
The Stone Temple report is a follow-up to its 2017 virtual assistant study and, therefore, it can provide insights into how voice search results have changed and improved in the past year. The 2018 study involved nearly 5,000 queries, compared across Alexa, Cortana, Google Assistant (Home and smartphone) and Siri.

Source: Stone Temple — Rating the Smarts of the Digital Personal Assistants” (2018)
What the company found was that Google Assistant was again the strongest performer, with the highest answer volume and percentage of correct answers. Cortana came in second, and Alexa saw the most dramatic improvement in terms of answer volume but also had the highest number of incorrect responses. Siri also made improvements but was last across most measures in the test.
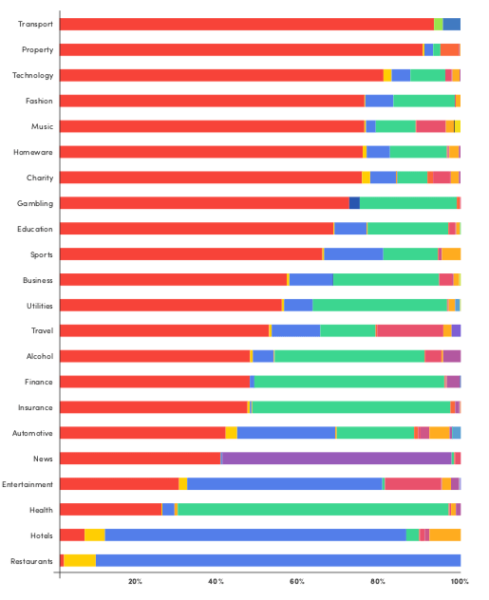
The ROAST report looked exclusively at Google Assistant results and determined the sources for the answers provided. It’s also a follow-up to an earlier report released in January. This new report examined more than 10,000 queries across 22 verticals, including hotels, restaurants, automotive, travel, education, real estate and others. In contrast to the Stone Temple results above, only 45 percent of queries were answered in the ROAST study.
One of the most interesting findings of the ROAST study is that the Google Featured Snippet is often not the go-to source for Google Assistant. In a number of cases, which varied by category, web search and Google Assistant results differed for the same query:
Results by vertical

Source: ROAST “Voice search vertical comparison overview” (2018)
Though it’s a bit challenging to read, the red bars in the chart above represent instances where the query was met with no response. Restaurants was the category with the smallest no-response percentage, while “transport” had the highest percentage of queries that failed to yield an answer. Below is a color legend indicating the data or answer sources according to ROAST:

Contributing authors are invited to create content for Search Engine Land and are chosen for their expertise and contribution to the search community. Our contributors work under the oversight of the editorial staff and contributions are checked for quality and relevance to our readers. The opinions they express are their own.


