During the holidays, there are a million different data points advertisers can look at to see how paid search is performing throughout this crucial shopping period. Depending on business goals and the type of products sold, which of those data points are most important for a particular site can vary widely from one brand to the next.
That said, there are a few overarching trends that apply to many advertisers and which help to set the stage for performance expectations over the coming weeks. Here I’ll outline four interesting paid search trends I’ll be keeping an eye on.
Will Black Friday continue to close the paid search sales gap on Cyber Monday?
Black Friday is for doorbusters. Cyber Monday is for online deals. That’s the way this thing is supposed to go, right?
The lines are blurring on those distinctions, with Black Friday Google paid search sales growth far outpacing that of Cyber Monday last year.

Paid search sales growth from 2015 to 2016 for Merkle advertisers.
Although Black Friday sales nearly equaled Cyber Monday’s in 2016 in aggregate, many smaller/individual sites still see the latter deliver much larger sales due to how they run their promotions. As a result, the median Merkle advertiser saw Google paid search sales 102 percent higher on Cyber Monday than on Black Friday in 2015, a gap that narrowed to 69 percent higher in 2016.
With so many early shoppers searching online rather than/in addition to in-store on Black Friday, paid search marketers must likewise expect to spend big on this historically brick-and-mortar sales holiday. It doesn’t appear that Black Friday will be able to knock off Cyber Monday as biggest paid search sales day of the holiday season for the median brand just yet, but it will be interesting to see just how close it gets.
Does Google Shopping have the juice to keep growing faster?
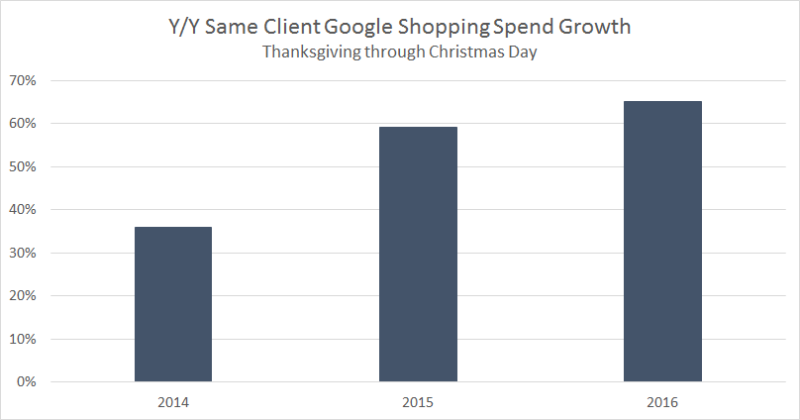
Online retailers are already well aware of the importance of Google Shopping, but did you also know that Product Listing Ad (PLA) sales between Thanksgiving and Christmas have grown faster year over year for two straight years?

There have been a lot of changes over the years to help spur on this growth, including:
- Google roughly doubling the size of PLAs on mobile devices in Q3 2015.
- Rapid impression growth beginning in early 2016.
- Yahoo’s move to begin showing Google PLAs on its domain in Q1 2016.
- The official rollout of PLAs to Google image search in Q2 2016 after months of low-volume testing.
Even with year-over-year growth numbers recently running up against stronger year-ago comparisons created by the early 2016 changes, Shopping has continued to grow impressively. Q3 PLA spend was up 37 percent, according to the latest Merkle Digital Marketing Report.

With Google’s recent release of Showcase Shopping Ads out of beta testing and the steady rise of Local Inventory Ads for brick-and-mortar advertisers, it’s not out of the question that advertisers could once again see holiday sales from these ads grow even faster.
One factor that’s likely to assist in that growth is that the period between Thanksgiving and Christmas this year is the longest it’s been since 2012 at 32 days. The number of days in this stretch has steadily increased since 2013, when there were just 26 days, and 2017 will be longer than 2016 by two days.
Will phones and tablets top 60% paid search traffic share?
Over the past few years, we’ve consistently seen the share of paid search clicks coming from phones and tablets rise in Q4 relative to Q3.

Most years, this increase is fairly modest, such as last year, when share went from 57.3 percent to 57.6 percent. Our data shows that 2015 had the largest growth in phone and tablet click share from Q3 to Q4. We believe this is because Google made several changes in the latter half of 2015 that significantly increased phone ad traffic, including adding a third text ad above organic links where there used to be only two and doubling the size of PLAs.
There haven’t been any major updates along the lines of what occurred in 2015 to suggest a big jump this year, but there are subtle trends that might help to increase mobile share nonetheless.
As I outlined last month, Google Local Inventory Ads and Maps ads play a bigger role during the holidays, and they are particularly important on mobile. With these ad units now accounting for much more traffic than last year, seasonal Q4 growth might help to boost overall mobile traffic share.
Could we see phones and tablets account for more than 60 percent of all paid search clicks in Q4? Perhaps. Google is already well over 60 percent, with Bing and Yahoo bringing overall mobile share down.
How big will Maps ads get on key days?
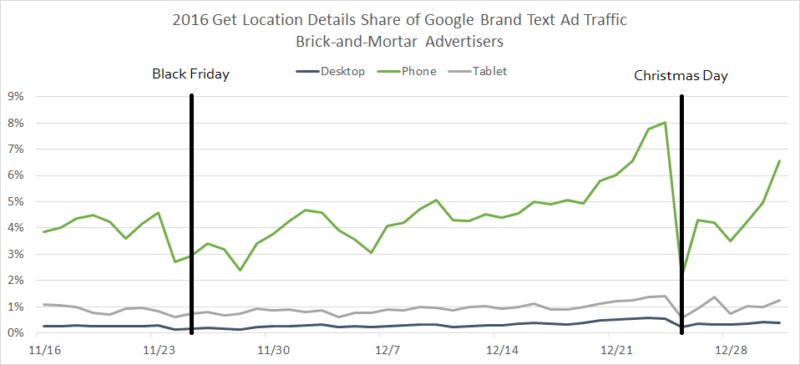
Last holiday season, brick-and-mortar brands saw a steady increase in traffic coming from the “Get location details” click type leading up to Christmas Day. This click type is attributed to text ads featured in Google Maps for any brand with active location extensions added to AdWords campaigns, and it accounts for the highest traffic share for brand text ads on phones.

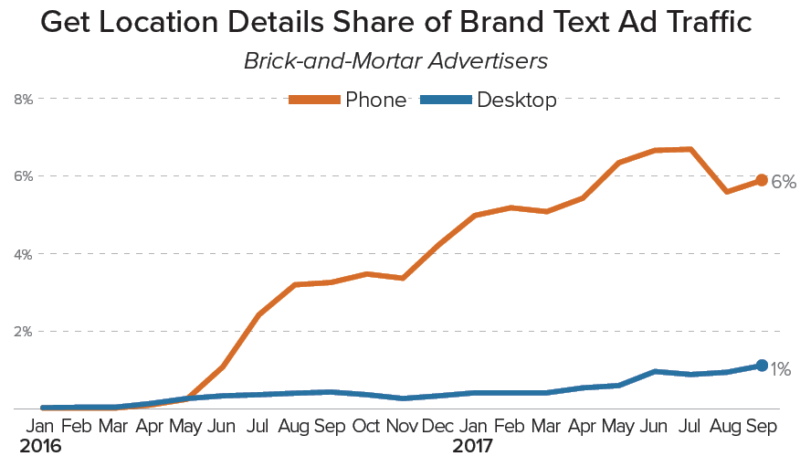
In 2016, the highest share of brand phone text ad traffic coming from these ads all year was 8 percent on Christmas Eve, as shoppers were looking to head in-store for last-minute purchases. Since then, “Get location details” click share has, on average, risen significantly.

As such, it’s fair to expect that we may see a significant increase this Christmas Eve from the 8 percent figure observed last year. I think there’s a chance that up to 15 percent of all phone brand traffic for brick-and-mortar brands will come from “Get location details” clicks on Christmas Eve — a pretty big chunk of clicks on an important day for a format that was only announced in mid-2016.
Conclusion
These predictions fall into four key themes that have played a huge role in the evolution of paid search over the past couple of years:
- The rise of online shopping in general has blurred the role of Black Friday, a historically brick-and-mortar sales holiday that’s now closing the gap on Cyber Monday in terms of paid search sales volume.
- Google Shopping has long outpaced text ads in terms of year-over-year growth (clicks, spend, sales, orders and so on) for online retailers, with holiday PLA sales growth accelerating relative to the year prior in both 2015 and 2016.
- Phones and tablets now account for more paid search traffic than desktop, and the click share of these devices will likely continue to grow this Q4, when we typically see a quarter-over-quarter lift in share.
- Lastly, users are increasingly turning to navigational tools like Google Maps for both brand and non-brand searches, and Google’s monetization of this traffic has likewise grown over the past year. These ads stand to be even more important for brick-and-mortar brands during the final days of the holiday shopping season.
So, those are four data points I’ll be keeping an eye on this coming shopping season and the broader themes each relates to. We’ll have to wait and see if my predictions come true, as well as to find out if any new and unexpected developments unfold.
Contributing authors are invited to create content for Search Engine Land and are chosen for their expertise and contribution to the search community. Our contributors work under the oversight of the editorial staff and contributions are checked for quality and relevance to our readers. The opinions they express are their own.


