

 The second session of SMX Advanced 2018 was the SEO Keynote: A Conversation with Google’s Ilya Grigorik.
Ilya is a Web Performance Engineer and also the co-chair of W3C Web Performance Working Group and author of the book “High Performance Browser Networking” (O’Reilly). He jokingly refers to himself as an internet plumber.
Here is the session overview:
The following are are my notes and insights from his interesting talk.
The keynote
The discussion centered on the Chrome User Experience report (CrUX report), and how we can use it to better understand how users experience our sites and our competitors’ sites.
The CrUX report is a good source of real-world data on user experience on a given page. The data is assembled from actual user sessions across the web, based on:
- Users who have opted in to sync their browsing history.
- Users who have not set up a Sync passphrase.
- Users who have usage statistic reporting enabled.
The data can then be accessed via Page Speed Insights. Here’s an example of what the report looks like:
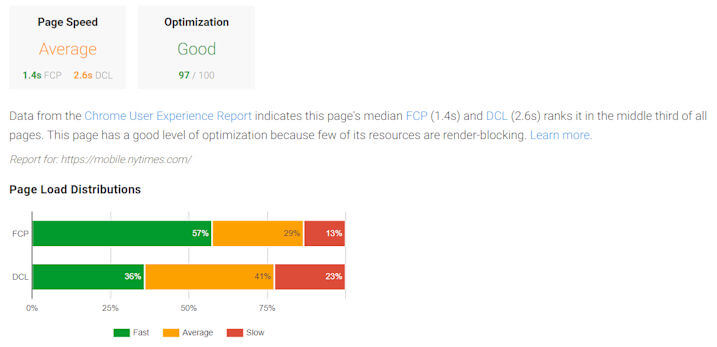
Ilya explained that the FCP metric stands for “First Contentful Paint.” This denotes when a user first sees a visual response. This metric is important because the first visual response provides users with an indication of action, and it helps keep them engaged.
DCL stands for DOMContent Loaded. It measures how long it takes for the document to be fully loaded and parsed. Stylesheets, images and subframes are the exceptions here. They may not show as complete in terms of loading.
Looking at our sample CrUX report above, notice how users are bucketed into three categories: fast (green), average (yellow) and slow (red). What Grigorik said next was an important insight: not all users get the same experience with your site; the percentages vary by category.
In the above diagram, 57 percent had a fast FCP, 29 percent average and 13 percent slow. For the DCL, we see 36 percent had fast, 41 percent average and 23 percent slow results. You also see that the median FCP was 1.4 seconds, and the median DCL was 2.6 seconds; this places it in the middle third of all pages.
Just to give you an idea of how this works for users, consider the following chart from this User-Centric Performance Metrics post by Google:
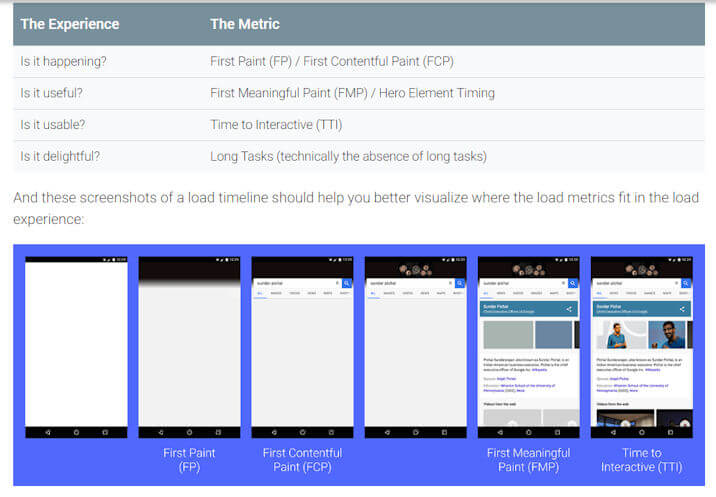
The sequence of site loading stages helps us understand what it is you need to work on optimizing. Note the additional metric of Time to Interactive (TTI). This is the point when users can begin to actively interact with the content. This is not something the CrUX report currently gives you, but it’s also something that you need to be concerned with.
Since the CrUX data is accessed via Page Speed Insights, you can pull this data for your competitors as well. Note: If you are pulling data on an individual page in Page Speed Insights, the CrUX report may not be available due to a lack of sufficient data. The message you’ll get back looks like this:

Make sure to enter in the full URL for best results. For example: “https://searchengineland.com/”, and not “searchengineland.com”, as the latter form will assume the HTTP protocol.
If your page traffic is too low to get the CrUX report, you can also enter a “site:” command into Page Speed Insights in this format: “site:https://searchengineland.com/” to get sitewide data.
If you enter “site:” only without the URL, you will only get the CrUX data from Page Speed Insights.
Grigorik emphasized the importance of optimizing for real-world experience and getting direct measurements of your own site. You can get sites where the real-world experience is good and the scores are low, and vice versa. Finding other tools that help you with that is a good idea.
Google Analytics
Google Analytics (GA) has some limited capability in this area. The Site Speed report in GA looks like this:
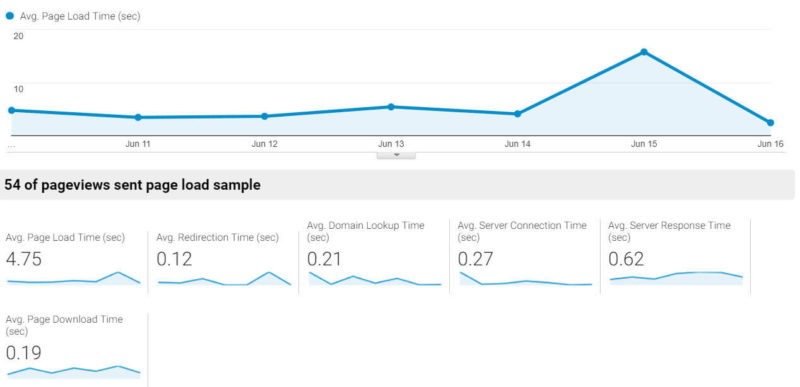
The metrics tracked by Google Analytics include:
- Average page load time.
- Average redirection time.
- Average domain lookup time.
- Average server connection time.
- Average server response time.
- Average page download time.
It’s interesting to drill down on some of the additional dimensions as well. For example, for this site, if we look at the browser breakout, here is what we see:
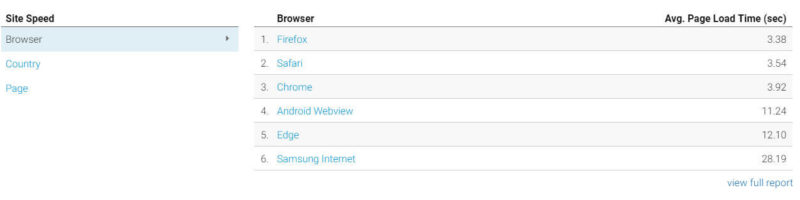
Did you notice the long load time for the Edge Browser and Samsung Internet? There may be some browser-specific problems with these two sites. Fixing them could help a lot of users (and increase overall scores, of course). These types of browser-specific problems are not something that the CrUX report would reveal.
What I’ve seen over the past several years is a ton of data showing how improving user experiences and page performance can lead to large increases in conversion. For example, looking at the above browser data, it’s highly unlikely anyone using an Edge or Samsung Internet browser is going to convert on that site.
Overall page and site performance are frontiers that have become increasingly important to address. Configuring web servers, content management systems and e-commerce platforms to make this happen is hard work, but the payoff is significant!
Are you planning to attend SMX East in October? Google’s Naomi Makofsky will be our SEO Keynote on day two. Naomi, who works on Global Product Partnerships for the Google Assistant initiative, will take you on a roller coaster ride from where we are today to what the future holds, including how some future tech is already here and having a significant impact on marketing campaigns. Hope to see you there!
Contributing authors are invited to create content for Search Engine Land and are chosen for their expertise and contribution to the search community. Our contributors work under the oversight of the editorial staff and contributions are checked for quality and relevance to our readers. The opinions they express are their own.

